Vous êtes ennuyés à l’idée de devoir attribuer un budget pour l’usage d’une pauvre petite Google map sur votre site ?
J’ai la solution pour vous !
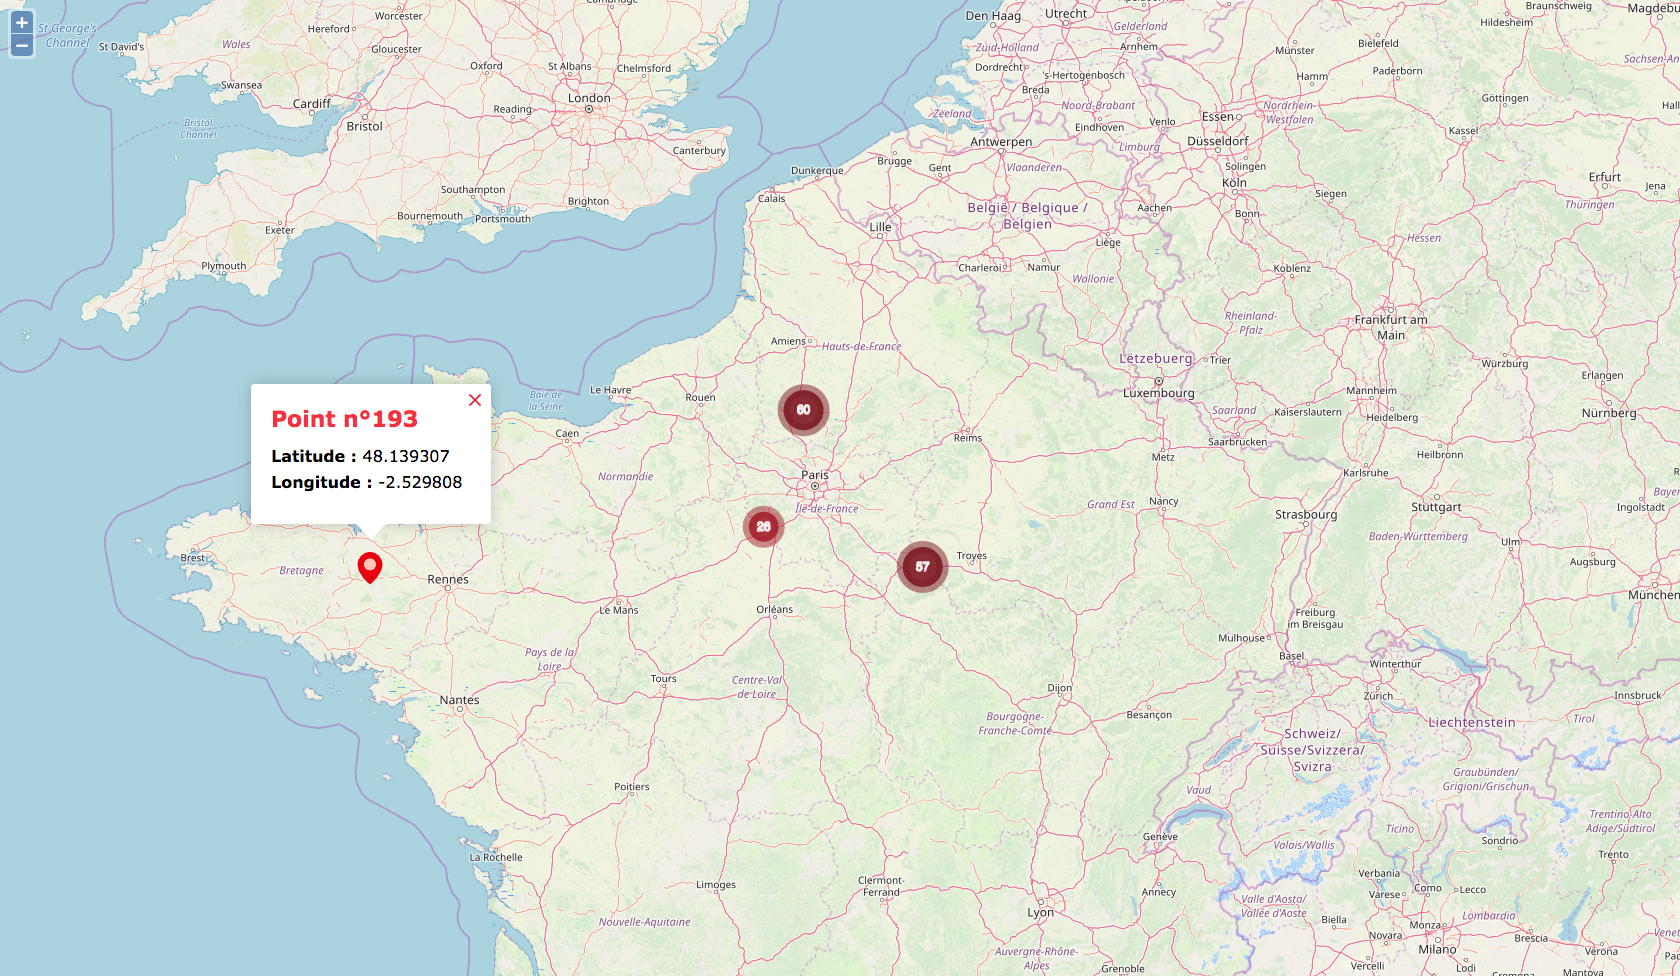
Je vais vous montrer comment créer une map avec OpenLayers, contenant markers, cluster, et popups.
Github : https://github.com/noemie-kerroux-opsone/openstreetmap-openlayers-animated-cluster
Sommaire
- Initialisation
- Création de la map
- Création du vector
- Préparation des markers
- Ajout des popups
- Fonctions utiles
Initialisation
Prérequis
Ce dont on aura besoin :
- OpenLayers : https://openlayers.org
- AnimatedCluster : http://www.acuriousanimal.com/AnimatedCluster/
- Un script pour notre map (exemple : map.js)
Base HTML
<body>
    <div id="map"></div>
    <script src="https://ajax.googleapis.com/ajax/libs/jquery/3.3.1/jquery.min.js"></script>
    <script src="http://www.openlayers.org/api/OpenLayers.js"></script>
    <script src="AnimatedCluster.js"></script>
    <script src="map.js"></script>
</body>
Préparatifs
Quels sont les ingrédients nécessaires pour créer une map ?
- Un objet de map, ça peut être pratique
- Un référentiel de coordonnées
- Un cluster qui contiendra les markers de points
- Un vector qui contiendra le cluster
// Variables
var map             = null;
var vector          = null;
var popup           = null;
var current_marker  = null;
var points          = [];
var clusterFeatures = [];
var zoom            = 7;
var base_lat = 48.8394505, base_lng = 2.6276102; // Localisation de base : Opsone

// Génération de 100 à 300 points près d'Opsone
var points_min = getRandomInRange(100, 300, 0);
for (var i = 0; i < points_min; i++) {
    var rand_lat = getRandomInRange(base_lat - 1, base_lat + 1, 5);
    var rand_lng = getRandomInRange(base_lng - 1, base_lng + 1, 5);
    points.push({lat: rand_lat, lng: rand_lng});
}
points.push({lat: 48.139307, lng: -2.529808});
Création de la map
/* Init Map */
map = new OpenLayers.Map("map"); // To remove map theme, call Map({ div: "map", theme: null })
map.addLayer(new OpenLayers.Layer.OSM());

/* Set map location */
var lonLat = new OpenLayers.LonLat( base_lng , base_lat ).transform(
    new OpenLayers.Projection("EPSG:4326"), // transform from WGS 1984
    map.getProjectionObject() // to Spherical Mercator Projection
);
map.setCenter (lonLat, zoom);
Création du vector
Style du vector
Avant de créer le vector, il faut lui définir un style (différentes couleurs en fonction de la densité du cluster)
// On définit des variantes de couleurs (ici on crée 3 niveaux de rouges plus ou moins foncés)
var colors = {
  low: "rgb(247, 49, 67)",
  middle: "rgb(163, 32, 44)",
  high: "rgb(125, 25, 34)"
};

// On définit les règles des styles
// Ici le premier niveau "lowRule" comprends toutes les features groupées entre 1 et 14.
var lowRule = new OpenLayers.Rule({
  filter: new OpenLayers.Filter.Comparison({
      type: OpenLayers.Filter.Comparison.LESS_THAN,
      property: "count",
      value: 15
  }),
  symbolizer: {
      fillColor: colors.low,
      fillOpacity: 0.9,
      strokeColor: colors.low,
      strokeOpacity: 0.5,
      strokeWidth: 12,
      pointRadius: 10,
      label: "${count}",
      labelOutlineWidth: 1,
      fontColor: "#ffffff",
      fontOpacity: 0.8,
      fontSize: "12px"
  }
});

// Le second niveau "middleRule" comprends toutes les features groupées entre 15 et 39.
var middleRule = new OpenLayers.Rule({
  filter: new OpenLayers.Filter.Comparison({
      type: OpenLayers.Filter.Comparison.BETWEEN,
      property: "count",
      lowerBoundary: 15,
      upperBoundary: 40
  }),
  symbolizer: {
      fillColor: colors.middle,
      fillOpacity: 0.9,
      strokeColor: colors.middle,
      strokeOpacity: 0.5,
      strokeWidth: 12,
      pointRadius: 15,
      label: "${count}",
      labelOutlineWidth: 1,
      fontColor: "#ffffff",
      fontOpacity: 0.8,
      fontSize: "12px"
  }
});

// Le troisième niveau "highRule" comprends toutes les features groupées plus grandes que 50.
var highRule = new OpenLayers.Rule({
  filter: new OpenLayers.Filter.Comparison({
      type: OpenLayers.Filter.Comparison.GREATER_THAN,
      property: "count",
      value: 50
  }),
  symbolizer: {
      fillColor: colors.high,
      fillOpacity: 0.9,
      strokeColor: colors.high,
      strokeOpacity: 0.5,
      strokeWidth: 12,
      pointRadius: 20,
      label: "${count}",
      labelOutlineWidth: 1,
      fontColor: "#ffffff",
      fontOpacity: 0.8,
      fontSize: "12px"
  }
});

// On crée le style qui utilisera les 3 règles définies ci-dessus.
var style = new OpenLayers.Style(null, {
  rules: [lowRule, middleRule, highRule]
});
Initialisation du vector
Pour notre exemple nous utiliserons Animated Cluster, une librairie permettant de créer un cluster qui s’animera à chaque changement du cluster.
vector = new OpenLayers.Layer.Vector("Features", {
    renderers: ['Canvas','SVG'],
    strategies: [
        new OpenLayers.Strategy.AnimatedCluster({
            distance: 120, // Distance in pixels to separate points
            animationMethod: OpenLayers.Easing.Expo.inAndOut,
            animationDuration: 50,
            threshold: 2
        })
    ],
    styleMap:  new OpenLayers.StyleMap(style),
});
map.addLayer(vector); // Le vector est prêt à accueillir le cluster !
Préparation des markers
Le cluster est la liste des features contenus dans le vector, nous devons donc lui ajouter toutes les features associées aux points créés.
/* Prepare markers */
var icon_path = 'images/marker.png';
var stylesMarkerImage = {
    externalGraphic : icon_path,
    graphicHeight : 32,
    graphicWidth : 32,
    graphicYOffset : -32,
    graphicXOffset : -16
};

for (var index in points) {
  var popup_details = "<div class='map-popup-inner'><div class='title'>Point n°" + index + "</div><p class='text'><strong>Latitude : </strong>" + points[index].lat + "<br><strong>Longitude : </strong>" + points[index].lng + "</p></div>";

  var flonlat = new OpenLayers.LonLat(points[index].lng, points[index].lat);
  flonlat.transform(new OpenLayers.Projection("EPSG:4326"), new OpenLayers.Projection("EPSG:900913"));

  var f = new OpenLayers.Feature.Vector( new OpenLayers.Geometry.Point(flonlat.lon, flonlat.lat), {
    id: index,
    lon: points[index].lng,
    lat: points[index].lat,
    desc: popup_details,
  }, stylesMarkerImage);
  f.attributes = { icon: icon_path, label: "myVector", importance: 10 };
  clusterFeatures.push(f);
}
vector.addFeatures(clusterFeatures);
Ajout des popups
Pour chaque feature créée, nous lui avons affecté un texte à afficher en popup au click sur cette feature, mais seulement si on clique directement sur le marker, et non sur un groupe de features. En bonus, nous allons changer l’icon du marker lorsque celui-ci est sélectionné.
map.events.register("featureclick", map, function(e) {
  popupClear();
  var refresh_vector = false;
  if( typeof e.feature.cluster !== 'undefined' && e.feature.cluster.length > 0 ) {
    popup = null;
  }else {
    var default_icon_path = 'images/marker.png';
    var current_icon_path = 'images/marker-selected.png';
    var stylesMarkerImage = {
      externalGraphic : current_icon_path,
      graphicHeight : 32,
      graphicWidth : 32,
      graphicYOffset : -32,
      graphicXOffset : -16
    };
    var stylesMarkerImageDefault = {
      externalGraphic : default_icon_path,
      graphicHeight : 32,
      graphicWidth : 32,
      graphicYOffset : -32,
      graphicXOffset : -16
    };

    var current_feature = vector.getFeatureById(e.feature.id);
    if( current_marker == null || current_feature.id !== current_marker.id  ) {
      if( current_marker !== null ) {
        current_marker.attributes = { icon: default_icon_path, label: "myVector", importance: 10 };
        current_marker.style = stylesMarkerImageDefault;
        vector.drawFeature(current_marker);
      }
      current_marker = current_feature;
      current_marker.attributes = { icon: current_icon_path, label: "myVector", importance: 10 };
      current_marker.style = stylesMarkerImage;
      vector.drawFeature(current_marker);
      refresh_vector = true;
    }

    var fdata = e.feature.data;
    var current_zoom = map.getZoom();
    var lonLat = new OpenLayers.LonLat( fdata.lon , fdata.lat ).transform(
      new OpenLayers.Projection("EPSG:4326"),
      map.getProjectionObject()
    );

    popup = new OpenLayers.Popup("mappopup",
      lonLat,
      new OpenLayers.Size(200,200),
      fdata.desc,
      true);
    map.addPopup(popup);
  }
  if(refresh_vector) {
    vector.refresh({force: true});
  }
});
Fonctions utiles
// Obtenir un nombre compris entre deux
function getRandomInRange(from, to, fixed) {
    return (Math.random() * (to - from) + from).toFixed(fixed) * 1;
}

// Nettoyer les popups
function popupClear() {
  popup = null;
  while( map.popups.length ) {
    map.removePopup(map.popups[0]);
  }
}

// Obtenir des coordonnées à partir d'une adresse :
var address = "MAIL BARTHELEMY THIMONNIER 77185 LOGNES";
var lonlat  = getLonLatByAdress(address);

function getLonLatByAdress(address) {
  var geoLonLat = null;
  var url_address = "https://nominatim.openstreetmap.org/search?q=" + encodeURI(address) + "&format=json&polygon=1&addressdetails=1";

  $.ajax({
    url: url_address,
    type: 'get',
    async: false,
    dataType: 'json',
    success: function(data)
    {
      if( typeof data !== 'undefined' ) {
        var olAdd = data[0];
        if( typeof olAdd !== 'undefined' && olAdd.lat.length > 0 && olAdd.lon.length > 0 ) {
          geoLonLat = {
            lon: olAdd.lon,
            lat: olAdd.lat
          };
        }
      }
    }
  });
  return geoLonLat;
}
Et voilà ! C’était pas bien compliqué non ?
– by Noémie Kerroux, Développeuse à OPSONE